Auto-Gen Report Center - RGS
Automated Report Generation Solution – Consolidate Data, Present Reports in Real-Time.
Discover the transformative capabilities of RGS in report automation, seamlessly aggregating factory and enterprise data to deliver precise, visualized analytical charts.
Excel struggles with real-time reports as data becomes larger and more complex.
Both IT and OT departments in factory have faced issues like "being limited to using Excel for reports, which becomes cumbersome and slow as data increases" or "the more systems there are, the more reports multiply, making centralized management difficult and finding reports a challenge."
Consolidate Data, Present in Real-Time
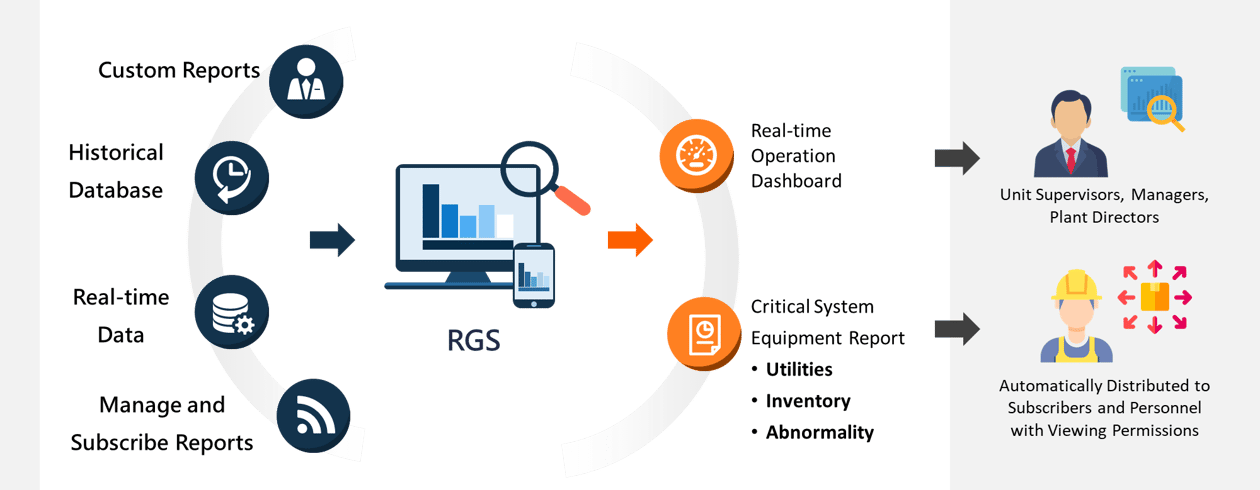
The Auto-Gen Report Center (RGS) is a comprehensive system designed to consolidate factory and enterprise data, facilitating the automatic generation of reports.
Access all pertinent report records online, ranging from abnormal incident reports and daily production reports to ERP-related reports.
RGS empowers your industrial organization to efficiently create the necessary reports on a daily basis.
Experience the evolution of report generation with RGS

Professional Data Visualization
RGS enables quick and easy transformation of data into visualized charts, uncover insights and thereby improving decision-making processes.
Automated Information Processing
With RGS, "highly repetitive manual tasks" can be transformed into automated workflows, producing scheduled reports and distributing them regularly to subscribers, improving operational efficiency.
Databases Integration
RGS consolidates various data sources, including historical databases and real-time data, such as MS SQL Server, Oracle, ODBC, ERP, and AVEVA software into, a comprehensive report, thereby facilitating in-depth business analysis.
Built-in Diverse Report Modules
Users can custom-design reports or use dashboards to centralize important real-time information, turning complex static data into dynamic, interactive smart dashboards, easily establishing a company war room.
Custom Visualizations, Centralized Management
Design custom visual dashboards for your real-time data monitoring without coding.
Centralized management and one-click report subscriptions keep you updated automatically.


No matter daily reports or dashboards,
RGS quickly converts data into visual charts and automates report generation and distribution. Custom-designed reports and real-time data can be integrated into interactive dashboards, even creating a company-wide war room if needed.

What our customers say
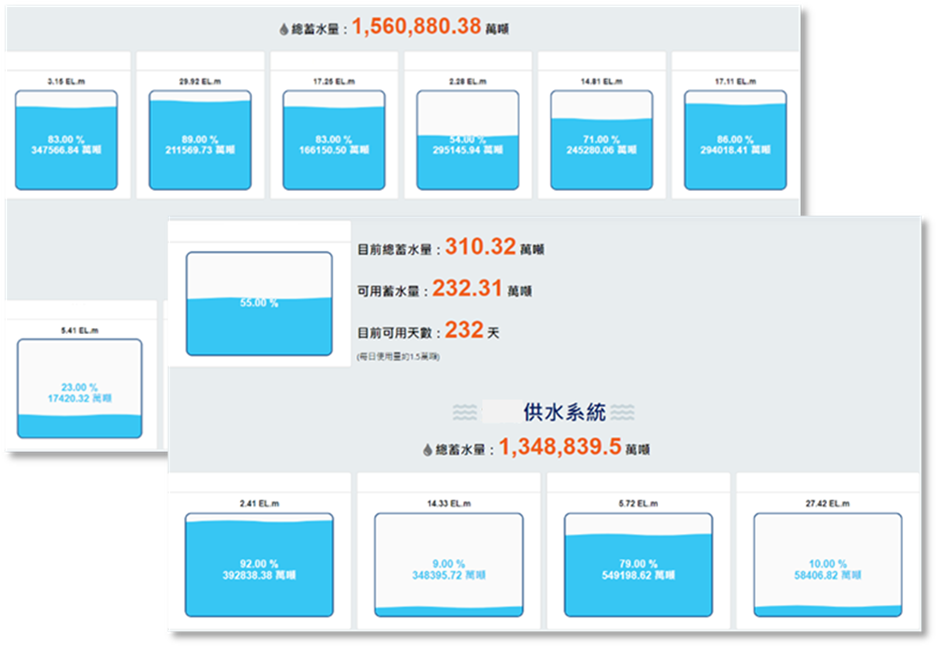
“We can obtain water information from any mobile device, such as first-hand information on water supply system conditions, reservoir storage, and days of water usage. This allows us to allocate reservoir and water resources in the water supply system in real-time and quickly, giving us more confidence in decision-making.”
“RGS provides us with a cross-departmental perspective to view and manage reports, greatly reducing the problem of scattered reports that are difficult to manage.”
“It integrates reports from various systems and helps us design, adjust, and modify reports in a more flexible and intuitive way. Compared to using Excel in the past, RGS significantly improves our efficiency in creating reports.”